Selected WorkProject 022026Business Intelligence
DirectorDashboard.
Business intelligence and operational visibility for a construction business.
A director-level dashboard bringing pipeline, project, financial, work-in-progress and risk information from connected business systems into one clear decision-making view.
- Next.js
- Supabase
- n8n
- GoHighLevel
- Xero
- WunderBuild
02Project
of 15
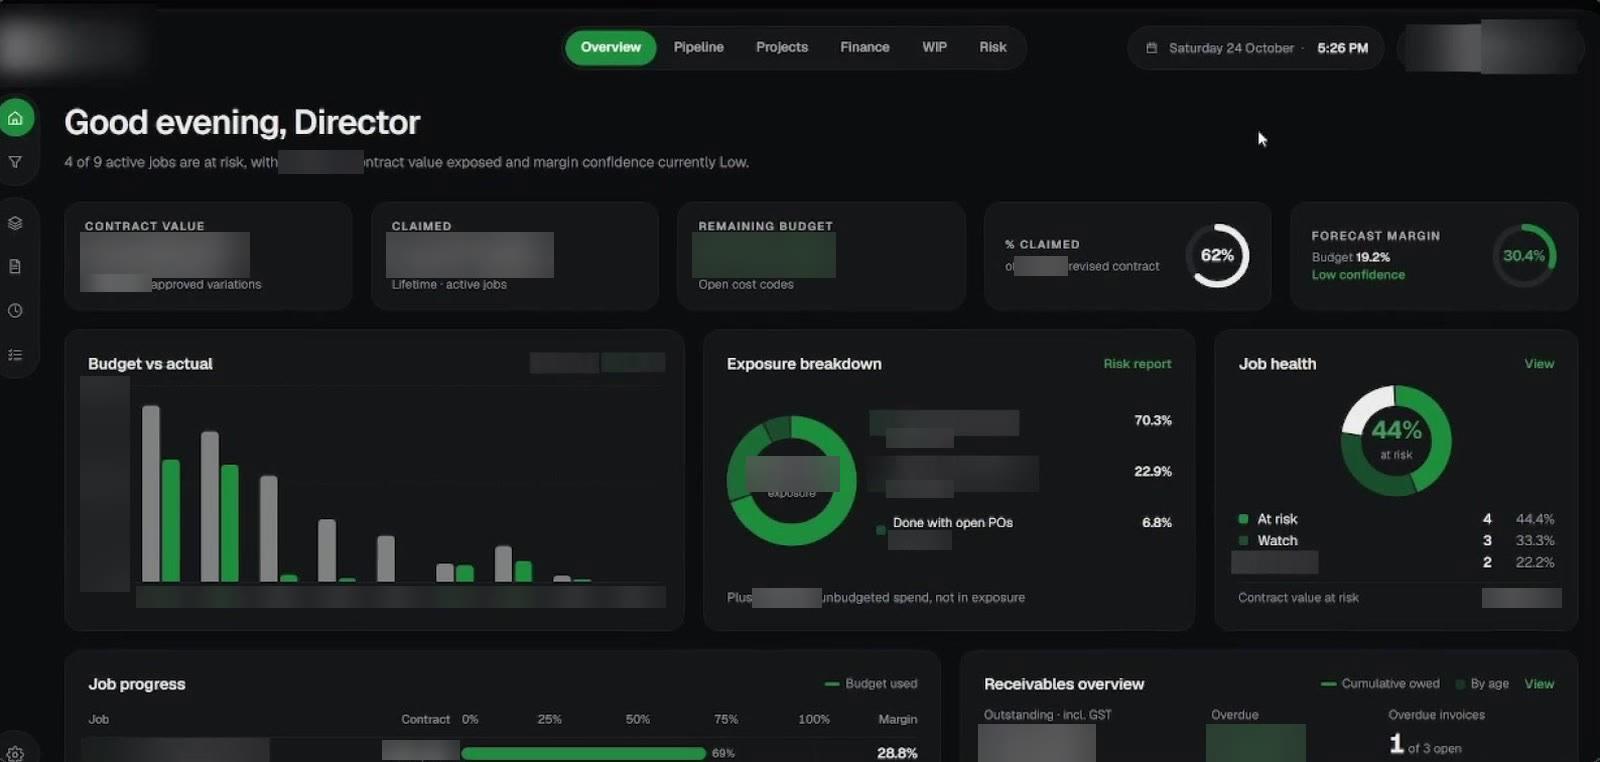 Open the full Overview (opens in a new tab)
- Construction business
- Business intelligence
- CRM, accounting and construction data, in one view
- In development
01The Challenge
Every answer meant opening another system.
Pipeline, project, cost and receivables information lived in separate systems — the CRM, the accounting platform and the construction platform — so understanding the business meant opening each one.
One operating view, calculated consistently from the same data rather than reconciled by hand.
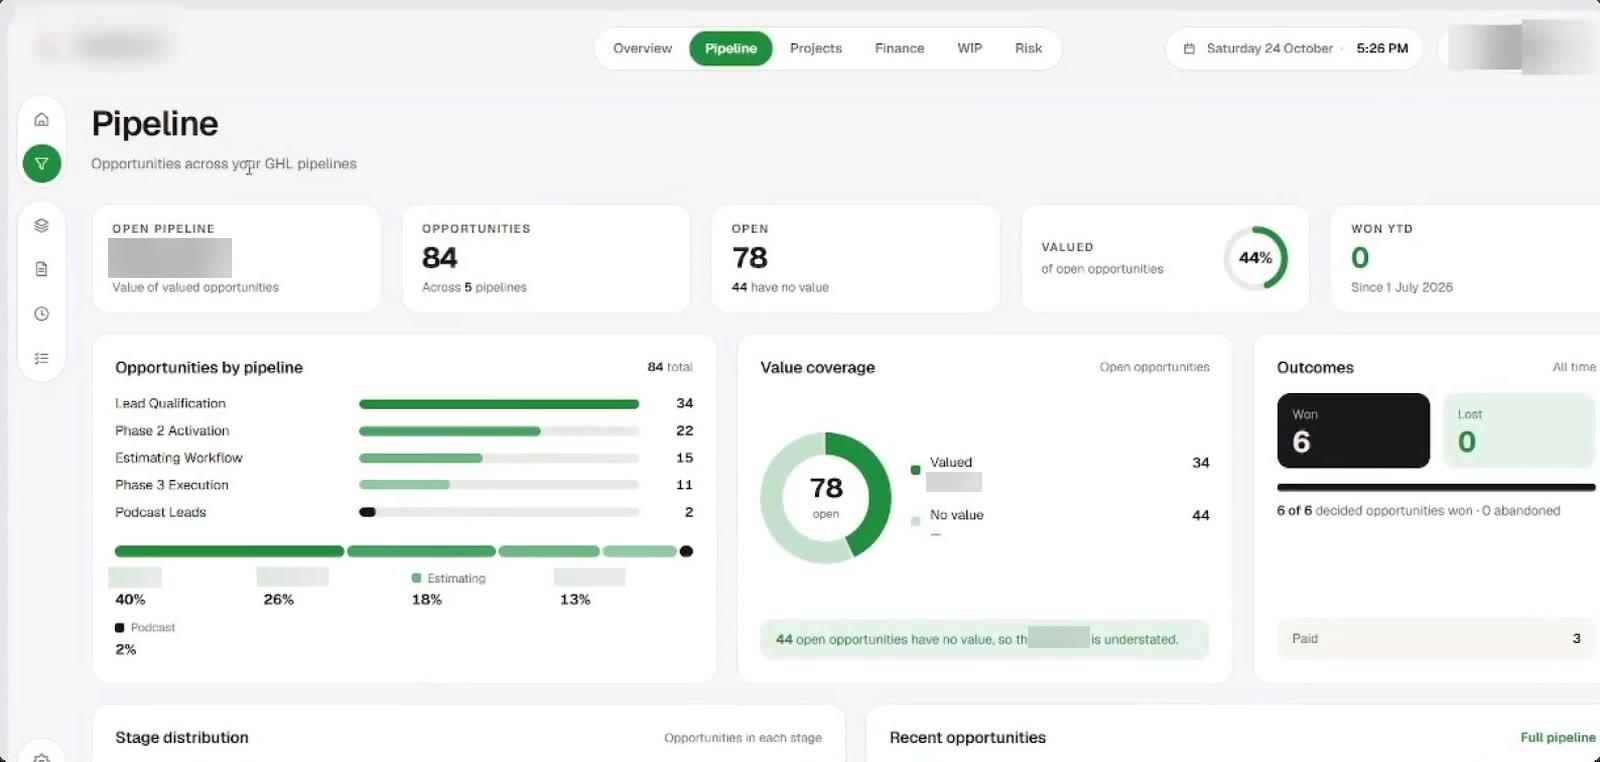
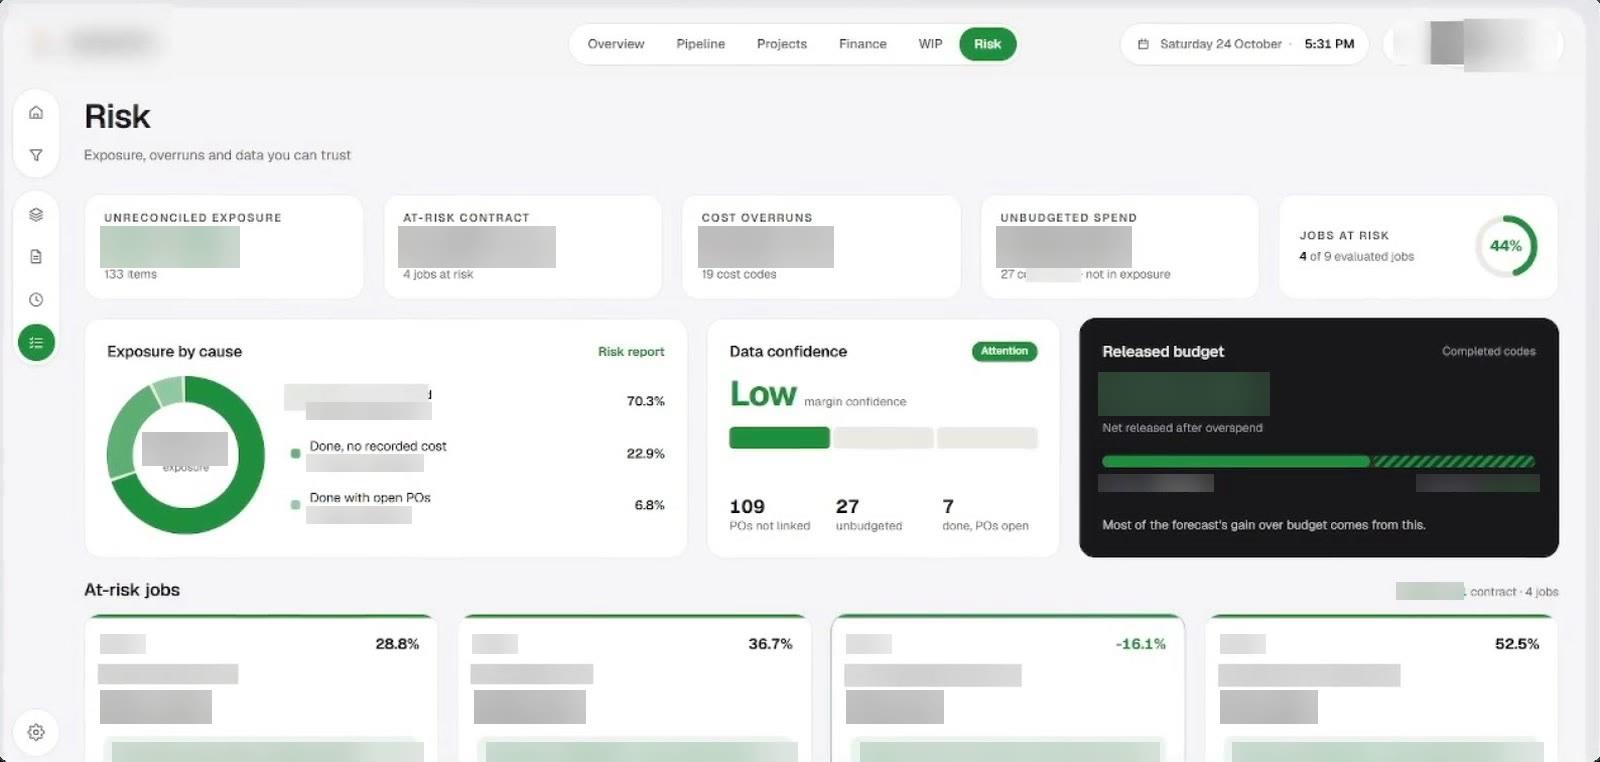
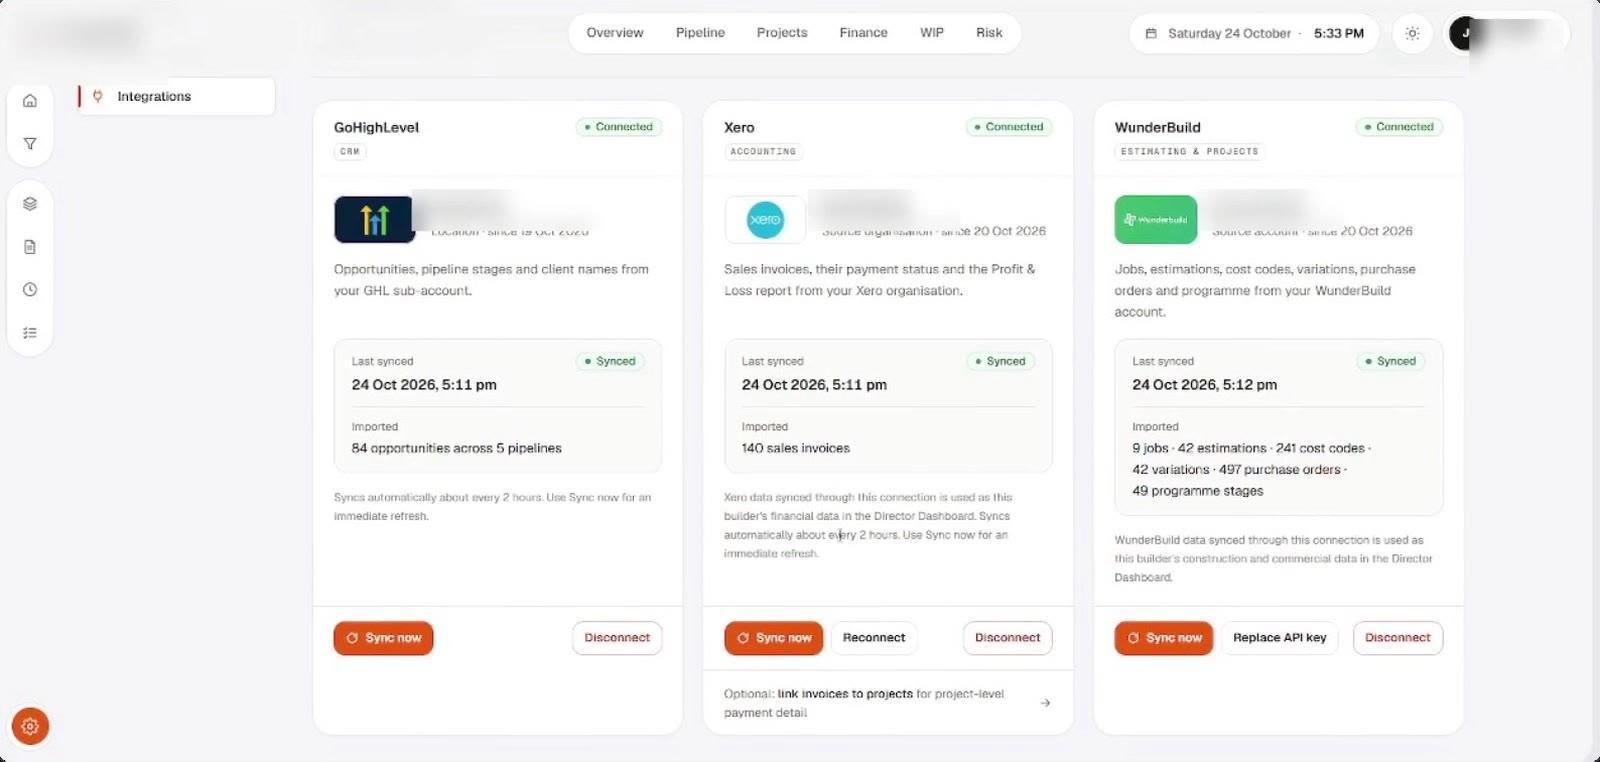
Overview in light and dark mode, pipeline, risk and integrations. Financial figures and identifying details are blurred.
02Director View
Six views. One source of truth.
Overview, Pipeline, Projects, Finance, WIP and Risk, all read from the same synchronised model.
A persistent frame keeps navigation, the organisation’s identity and the theme in place while the views change beneath it.
- GoHighLevel, Xero and WunderBuild
- Normalised, tenant-scoped data in Supabase
- Calculated by the application, deterministically
03How It Works
Synchronise first. Then read one model.
Four steps from connected sources to the figures a director sees.
Connect
Each organisation connects its own GoHighLevel, Xero and WunderBuild sources.
Per organisationSynchronise
Source data is pulled in and normalised into one operational model. No vendor API is called while a page renders.
Integration layerCalculate
Server loaders read the tenant-scoped model and calculate every figure.
DeterministicPresent
Six views read the result; summary sentences are built from the loaded facts, with no model call.
No AI at render
04Architecture
From connected sources to a director’s view.
Sources are synchronised and normalised first; every figure is then calculated from one tenant-scoped model.
01Sources
- CRM pipelineGoHighLevel (Third-party handoff)
- Invoices & receivablesXero (Third-party handoff)
- Projects & commercialWunderBuild (Third-party handoff)
02Integrate
- Integration layerSync & normalise
- Tenant-scoped dataSupabase
03Calculate
- Next.js server loadersKPI & insight layer
- From loaded facts, no AI callInsight sentences
04Present
- BusinessOverview & PipelineDeliveryProjects & WIP
- ReceivablesFinanceExposureRisk
- System stage
- Third-party data source
Data flows one way: sources are synchronised into Supabase, the application calculates every figure, and the views read the result. Every read is scoped to the signed-in organisation.
05Data Controls
Figures a director can rely on.
The same data always gives the same figures, and every read stays inside its own organisation.
- Source integrations (GoHighLevel, Xero, WunderBuild)Built
- Tenant-scoped data modelBuilt
- Deterministic KPI layerBuilt
- Overview, Pipeline and Risk viewsBuilt
- Each builder works in a private tenant; every read is scoped to verified membership and fails closed on errors.
- Figures are calculated by the application from normalised records, so the same data always gives the same result.
- Summary sentences are built from the loaded facts with controlled variants; no model call at render time.
- Overdue invoices are classified in the builder organisation’s timezone, so date boundaries stay correct.
- Loading never shows 0 or $0, because zero is a valid business result.
06The Stack
Each tool has a defined job in the system.
Roles over logos. Only integrations that exist in the build are listed.
Next.js
Web application and server loaders
Supabase
Tenant-scoped application data
n8n
Workflow automation
GoHighLevel
CRM pipeline, third-party source
Xero
Invoices and receivables, third-party source
WunderBuild
Projects and commercial, third-party source
07The Outcome
What the dashboard does.
One operating view of pipeline, project load, cash, work in progress and risk.
A multi-tenant dashboard that synchronises and normalises CRM, accounting and construction data, then presents Overview, Pipeline, Projects, Finance, WIP and Risk views from that one model.
- Product Architecture
- Dashboard Engineering
- Data Integration
- Multi-Tenant Data Model
- KPI & Calculation Logic
- Dashboard UX/UI
- Connects GoHighLevel, Xero and WunderBuild per organisation
- Normalises source data into one tenant-scoped model
- Calculates every KPI deterministically, in the application
- Presents director views from that one model
- Keeps each organisation’s data isolated, failing closed on errors
Contact
Have a workflow, dashboard or CRM that needs fixing? Let’s talk.
Available for new projects
Tell me about the operation, the systems involved and where the work gets stuck. A short call is usually enough to see whether I can help.